Forecasting FRED Data on Employment in the Financial Activities Sector
David Pershall
Financial Activities
Every month the U.S. Bureau of Labor Statistics publishes employment figures for large sections of the U.S. Economy. The task is to forecast the amount of people employed in the financial activities sector for four years. This information is publicly reported by the St. Louis FRED and can be found at the following link. https://fred.stlouisfed.org/series/USFIRE.
Four years represents a large amount of time and confidence windows will be wide. Therefore, I will test a few forecasting models by comparing their respective RMSE and Winkler scores on a known portion of the time series.
Options, Libraries, and Pull
#Libraries
if(!require(pacman))
  install.packages("pacman", repos = "http://cran.us.r-project.org")
pacman::p_load("tidyverse", "fpp3", "fable.prophet", "ggpubr")
#Pull
tmp <- tempfile()
download.file("https://fred.stlouisfed.org/graph/fredgraph.csv?bgcolor=%23e1e9f0&chart_type=line&drp=0&fo=open%20sans&graph_bgcolor=%23ffffff&height=450&mode=fred&recession_bars=on&txtcolor=%23444444&ts=12&tts=12&width=1169&nt=0&thu=0&trc=0&show_legend=yes&show_axis_titles=yes&show_tooltip=yes&id=CEU5500000001&scale=left&cosd=2000-01-01&coed=2023-01-01&line_color=%234572a7&link_values=false&line_style=solid&mark_type=none&mw=3&lw=2&ost=-99999&oet=99999&mma=0&fml=a&fq=Monthly&fam=avg&fgst=lin&fgsnd=2020-02-01&line_index=1&transformation=lin&vintage_date=2023-02-20&revision_date=2023-02-20&nd=2000-01-01", tmp)Transform
Now that we have the data pulled and stored, we need to transform it into a a workable time series structure.
actual <- read.csv(tmp, col.names = c("Date", "Employed")) %>%
  mutate(Date = as.Date(Date),
         # Data provides the number of people in Thousands of persons so let's
         # adjust that to millions for easier reading
         Employed = Employed/1000,
         Month = yearmonth(Date)) %>%
  dplyr::select(Month, Employed) %>% as_tsibble(index = Month)
Exploration
autoplot(actual, Employed) +
  labs(title = "US employment: Financial Activities",
       y = "Number of people (millions)")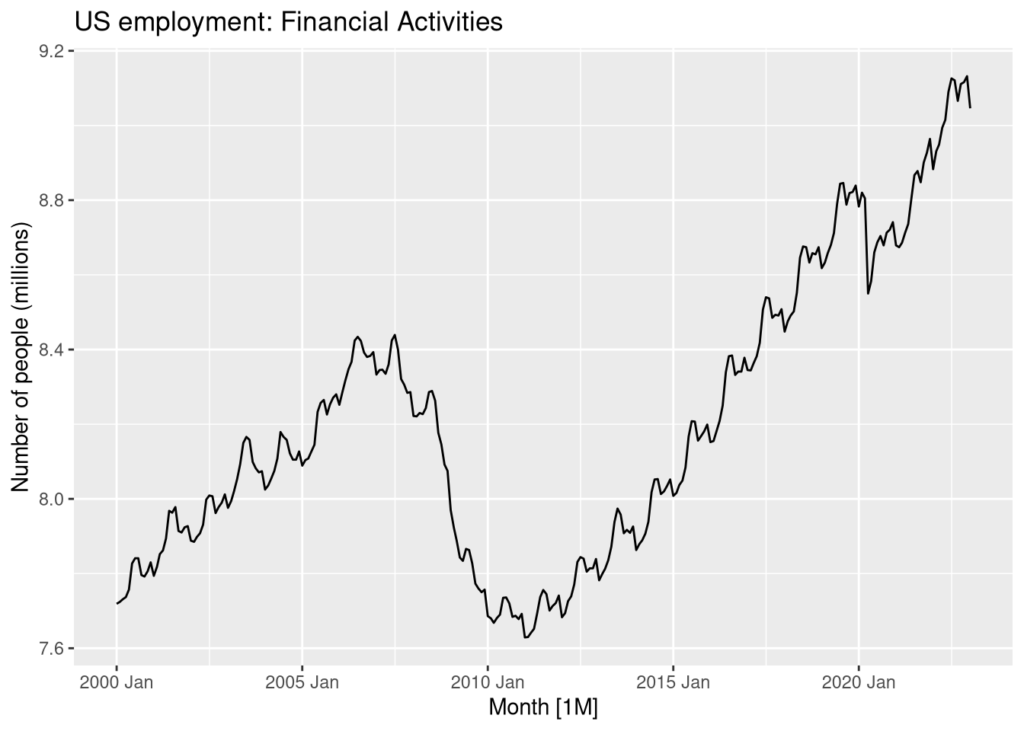
A few observations from this simple plot are that the data is non-stationary and appears to have some seasonality. We can also observe the 2008-10 recession as well as a sharp slump due to the outbreak of the Covid-19 pandemic in 2020.
Seasonality
Let’s take a closer look at the seasonality by plotting it.
actual %>% gg_season(Employed, period = "year")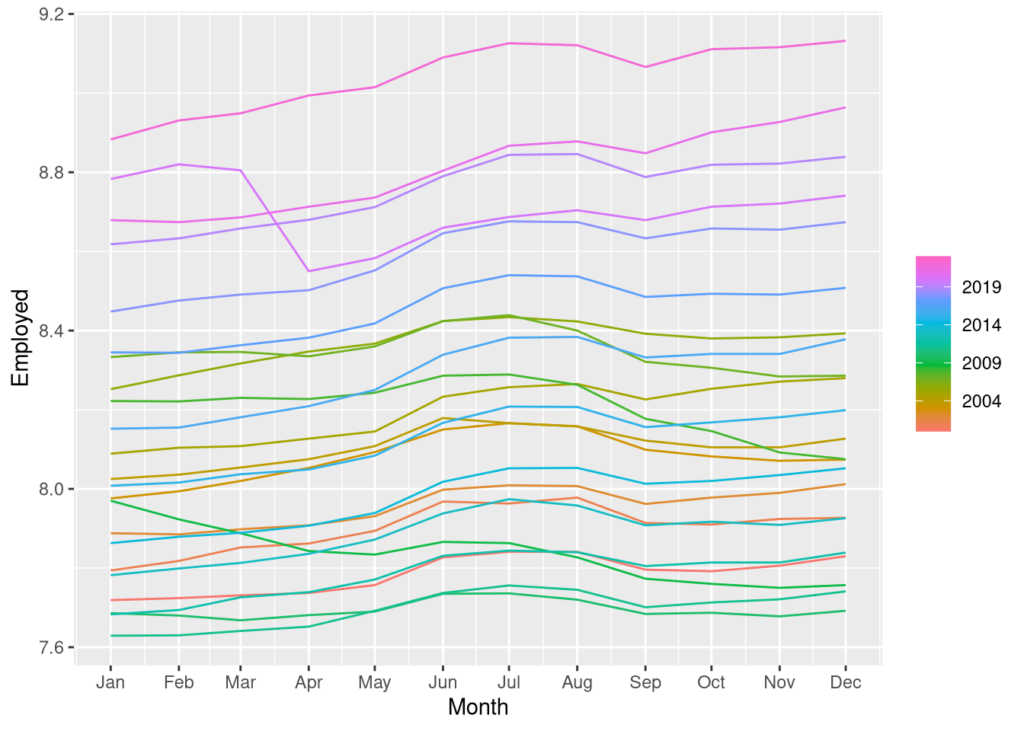
We can see some trends forming in the seasonal chart above. On average, the months of May and June tend to see a rise in the number of people joining the financial activities workforce, followed by a trimming in August. We also see the sharp declines caused by the 2020 Covid-19 pandemic and the 2008-10 financial crisis. These stand as the exception to the rule of generalized growth in the rate of people employed in financial activities.
The Split
The first task is to split the data so that we have a training set and a test set to perform the accuracy tests against.
train <- actual %>%
  filter(year(Month) <= 2018)
test <- actual %>%
  filter(year(Month) >= 2019)
rm(actual)
gc()
## used (Mb) gc trigger (Mb) max used (Mb)
## Ncells 1331188 71.1 2201864 117.6 2201864 117.6
## Vcells 2325831 17.8 8388608 64.0 3871675 29.6Differencing
Since the data is non stationary, let’s go ahead and difference the data and run a preliminary ACF and PACF analysis.
train %>%
  gg_tsdisplay(difference(Employed, 12),
               plot_type = "partial", lag = 50) +
  labs(title = "Seasonally differenced", y = "")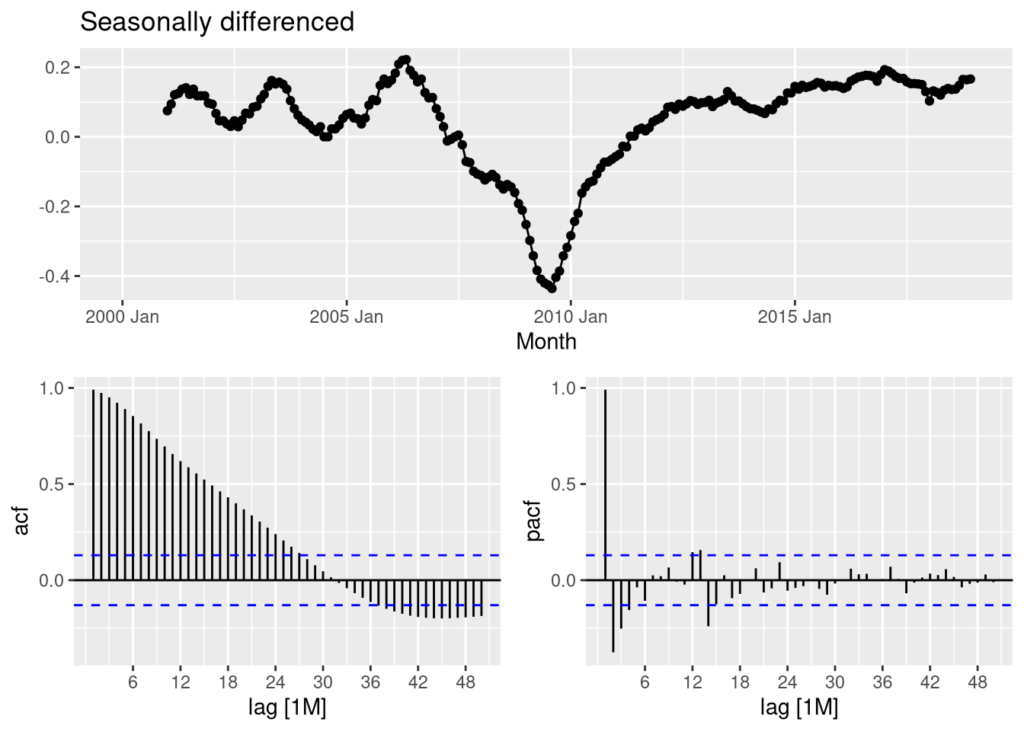
In the above seasonally differenced graph we see too many lines pass the 20% correlation cut-off in the ACF and PACF plots. This suggests we should difference the data again.
train %>%
  gg_tsdisplay(difference(difference(Employed,12)),
               plot_type = "partial", lag = 50) +
  labs(title = "Double differenced",
       y = "")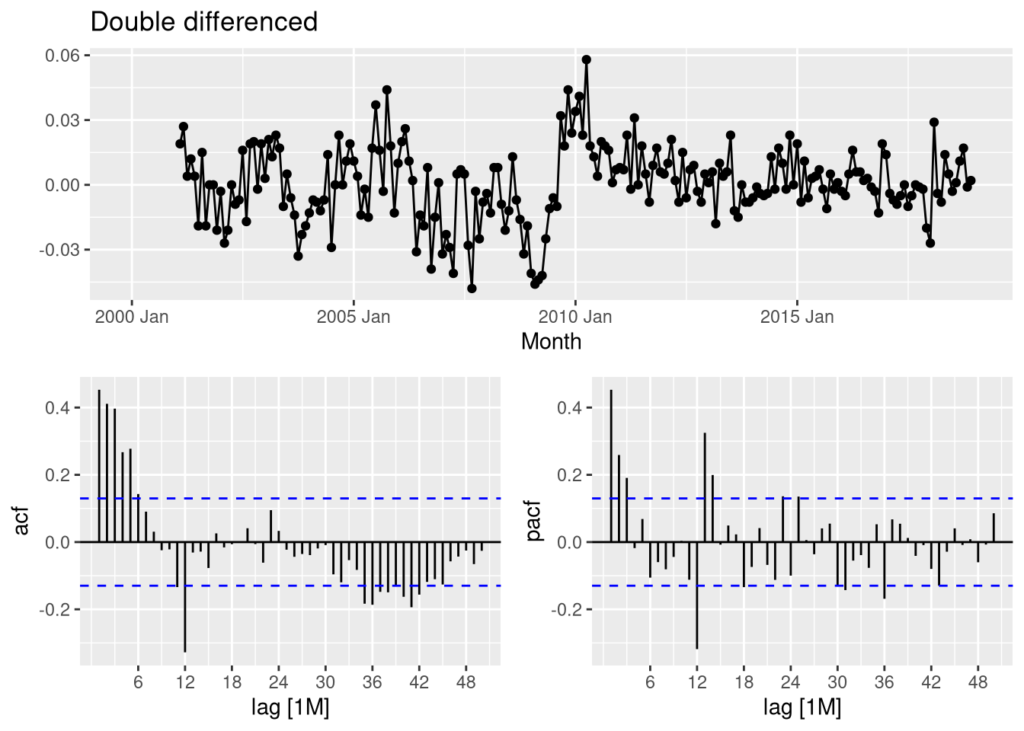
In the double differenced graph we see that the series more closely resembles white noise, and could be ready for the model fitting process.
The fits
The goal is to find the most accurate model for forecasting this series based on minimizing the RMSE and Winkler score. Since there are considerable spikes remaining in the double differenced ACF and PACF plots, I will conduct a search for the best ARIMA model and the best STLF model. This will take more time than constructing one myself. However, I am only working with one series, so the time spent will be worth while. I will also fit a Seasonal Naive model, an ETS model, a Prophet Model, and one combination model.
STLF = decomposition_model(STL(Employed ~ season(window = Inf)),
                               ETS(season_adjust ~ season("N")))
fits <- train %>%
  model(
    stlf = STLF,
    ets = ETS(Employed),
    seasonal_naive_drift = SNAIVE(Employed ~ drift()),
    prophet = prophet(Employed ~ season(period = 12, order = 2,
                                      type = "multiplicative")),
    arima_search = ARIMA(Employed, greedy = F, stepwise = FALSE, approx = FALSE),
    ) %>% mutate(combination = (ets + stlf + arima_search + seasonal_naive_drift) / 4)
fits
## # A mable: 1 x 6
## stlf ets seasonal_naive_drift prophet
## <model> <model> <model> <model>
## 1 <STL decomposition model> <ETS(M,Ad,M)> <SNAIVE w/ drift> <prophet>
## # ℹ 2 more variables: arima_search <model>, combination <model>Preliminary Plots
We can go ahead and plot the forecast means as a preliminary examination of the models.
Employment_forecasts <- fits %>%
  forecast(h = "4 years")

Employment_forecasts %>%
  autoplot(train,
           level = NULL) +
  labs(y = "Number of People (Millions)",
       title = "US employment: Financial Activities")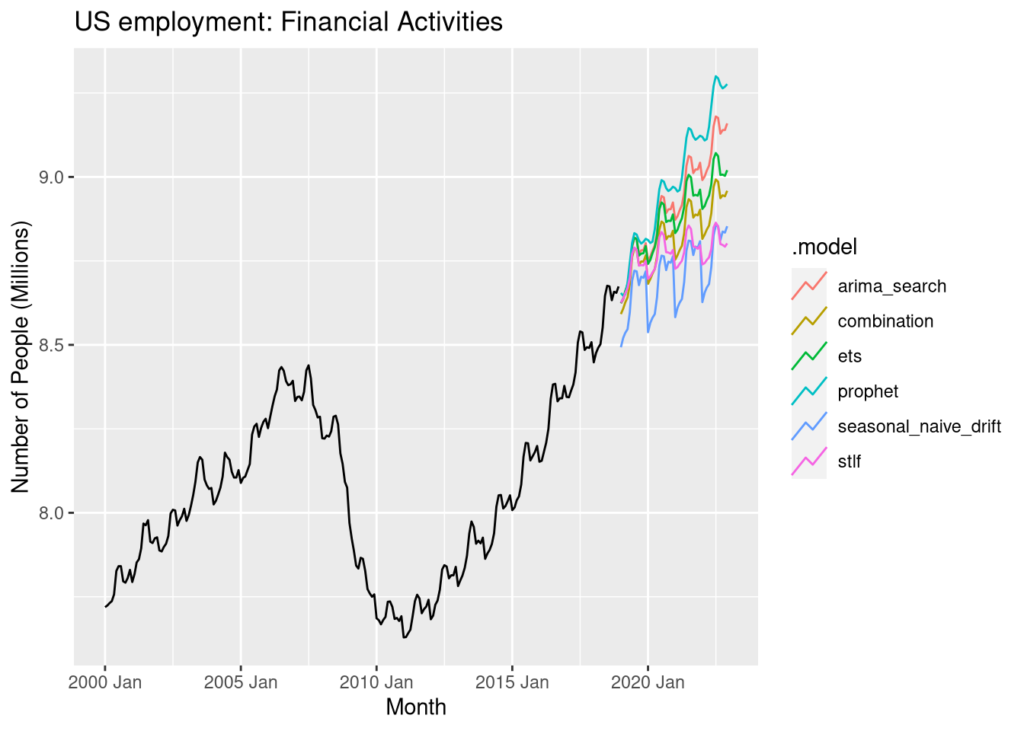
The residuals
Let’s dig a little deeper in our exploration of the models. One way of comparing and contrasting models is to plot their residuals. Since we are more focused on RMSE and the Wilder score, I will only include the Arima search model and the Prophet models as an example of this approach.
fits %>% dplyr::select(arima_search) %>% gg_tsresiduals(lag = 56) + labs(title = "Arima search", y="")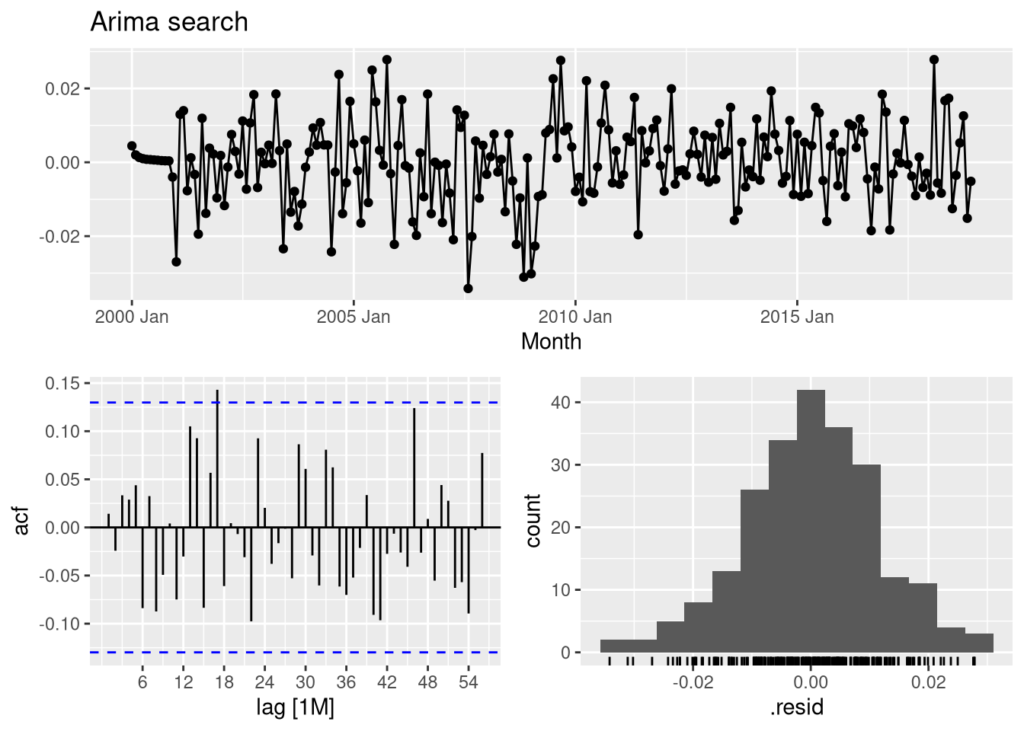
We can see that the Arima search model does good job of capturing the information available in the data. The ACF plot of the Arima search model resembles that of white noise, and the distribution of the residuals is close to a normal distribution.
fits %>% dplyr::select(prophet) %>% gg_tsresiduals(lag = 56) + labs(title = "Prophet", y="")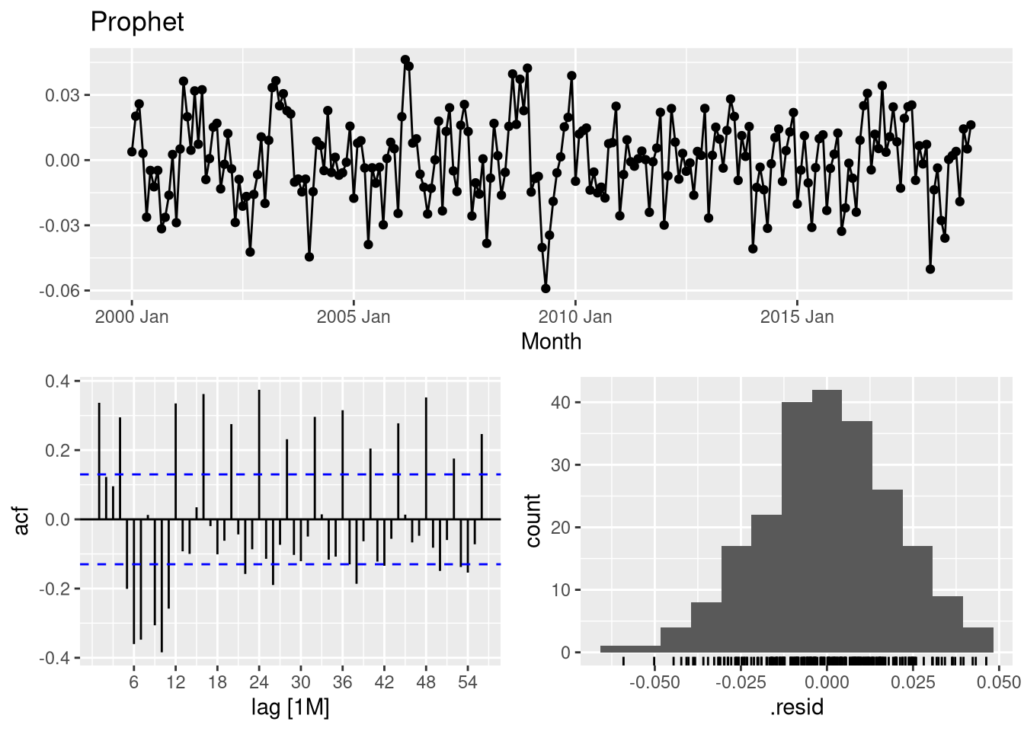
The Prophet model above does not do as good a job of capturing the information available in the data. There are still too many spikes in the ACF plot and the distribution shows abnormalities. We can safely assume the Arima model will perform better than the prophet model.
RMSE
We can calculate the RMSE of the models against the test set to see which one performs the best. If we were correct with the examination of the residual plots above we can expect the arima model to perform much better than the prophet model.
Employment_forecasts %>%
  accuracy(test) %>% dplyr::select(.model, RMSE) %>%
  arrange(RMSE)
## # A tibble: 6 × 2
## .model RMSE
## <chr> <dbl>
## 1 combination 0.107
## 2 ets 0.118
## 3 arima_search 0.137
## 4 stlf 0.149
## 5 seasonal_naive_drift 0.169
## 6 prophet 0.201We were correct with our examination of the earlier plots. The Arima search model does much better than the prophet model. The combination model has the lowest RMSE making it the best approach. While this is a simple linear combination, there is much work being done combining forecasting models using different methods, and the combination models almost always outperform a singular model by itself. Notably, the very popular prophet model has the highest RMSE making it even less accurate than the seasonal naive with drift model.
Winkler Score
Next up, I will generate 5000 future sample paths and their distributions in order to match the distributions already stored in the construction of the prophet model. This will allow me check for accuracy using a Winkler test. Just like RMSE, the lower the Winkler score the better.
Employment_futures <- fits %>% dplyr::select(c("ets", "stlf", "arima_search",
                                              "seasonal_naive_drift",
                                              "combination")) %>%
  # Generate 5000 future sample paths
  generate(h = "4 years", times = 5000) %>%
  # Compute forecast distributions from future sample paths
  as_tibble() %>%
  group_by(Month, .model) %>%
  summarise(dist = distributional::dist_sample(list(.sim))) %>%
  ungroup() %>%
  # Create fable object
  as_fable(index = Month, key = .model,
           distribution = dist, response = "Employed")


# Match the prophet 5000 future sample paths and join with Employment Futures
prophet_futures <- Employment_forecasts %>%
  filter(.model=="prophet") %>%
  dplyr::select(.model, Month, Employed) %>%
  `colnames<-`(c(".model","Month","dist")) %>%
  as_fable(index = Month, key = .model, distribution = dist,
           response = "Employed")

Employment_futures <- Employment_futures %>%
  full_join(prophet_futures,
            by = join_by(Month,.model,dist))

# Winkler test
Employment_futures %>%
  accuracy(test, measures = interval_accuracy_measures,
           level = 95) %>%
  arrange(winkler)
## # A tibble: 6 × 3
## .model .type winkler
## <chr> <chr> <dbl>
## 1 combination Test 0.464
## 2 ets Test 0.696
## 3 seasonal_naive_drift Test 0.841
## 4 stlf Test 0.917
## 5 arima_search Test 0.979
## 6 prophet Test 1.08Final Model
The combination model is the most accurate according to RMSE and and the Winkler test. Let’s visualize how the model performs with a simple plot.
forecast(fits, h= "4 years") %>%
  filter(.model=='combination') %>%
  autoplot(train) +
  autolayer(test, Employed, color = "red") +
  labs(title = "US employment: Financial Activities",
       y="Number of people (millions)",
       x = "Year/Month")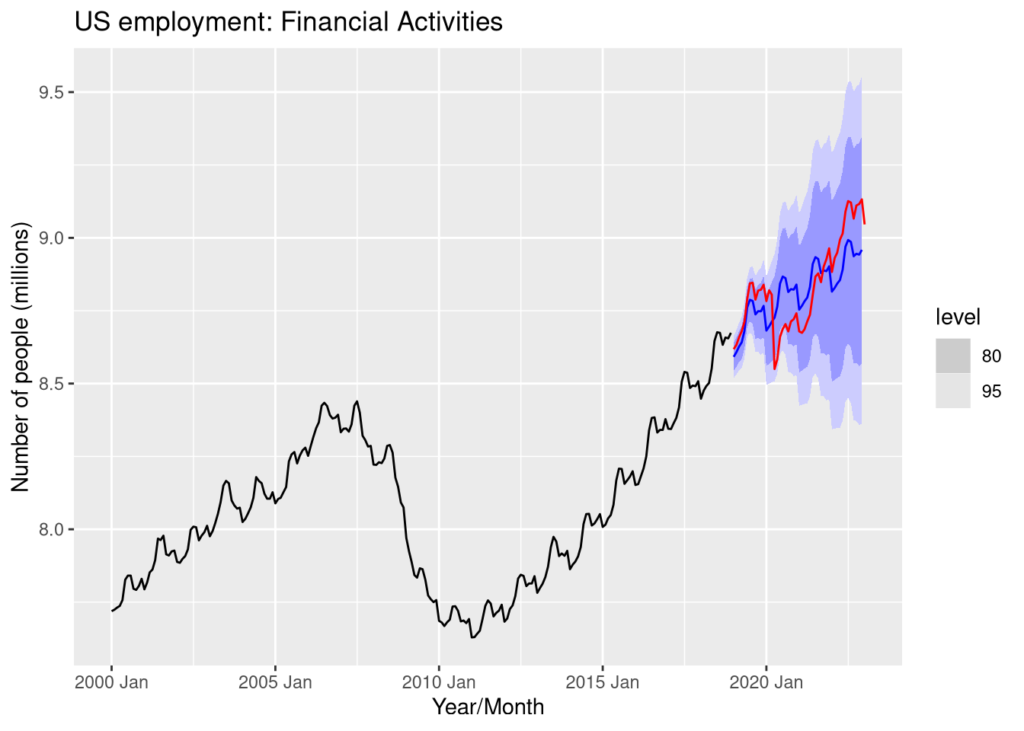
Summary
A couple of observations jump out right away from this investigative journey. The final combination model is extremely accurate within the first year. This is followed by the 2020 decline. No statistical model could have possibly foreseen the Covid-19 pandemic, nor the economic challenges it wrought. If I was responsible for producing short term forecasts of month to month changes during 2020, I would have been forced to use some form of scenario based forecasting which would have included some generalized economic data. I would have also considered assembling a panel of experts to help produce a Delphi forecast.
When we move past the first two years, the shaded prediction intervals in all models are extremely wide. Therefore, it would make more sense to forecast this particular series two years at a time instead of four. A well trained long term forecast of 4 to 5 years, however, is still quite useful for evaluating the realm of possibilities the future may bring.